EonLabs Data Scientist Project
Source: Notion | Last edited: 2024-09-26 | ID: d9b5b010-a67...
Background
Section titled “Background”The general goal of this project is to build a model that can improve profitability and lower the trading risk of the current strategy. More specifically, there are two interesting things that we could do:
- Enigma Switch - EonLabs has developed a trading strategy called ‘Enigma’** **and has used it since 2020. We have noticed that this strategy works the best when the crypto market has high volatility. However, when the market is quiet, our profit gets lower and is often eaten by transaction fees. Hence, it would be interesting to build a model to predict when we should trade using Enigma, like a switch. If ‘switch’ says yes, we turn Enigma on to trade, otherwise, we wait. Of course, this ‘switch’ can be a real value between 0 and 1, representing a weight or probability.
- Optimal Fund Allocator - In Enigma, we could choose to allocate our fund to trade which crypto symbols, e.g. Bitcoin, Ethereum, etc. During trading, when Enigma Bitcoin models made a profit and during the same period, the Enigma Ethereum models had a loss, we would allocate more of the fund to Bitcoin. At the moment, this is still made by a human decision. In addition, we have Enigma models with different time intervals, e.g. 15m, 2h, etc. Similarly, certain time intervals may work better than others in certain market scenarios. It would be helpful to create a smart ‘allocator’ that can automatically identify the right crypto symbols or choose the right intervals to trade at any given time.
To achieve the two goals above, we have provided the following data:
- Performance of Enigma, which is profit and loss (pnl) data of trading models of different symbols and different intervals from 2018 till 2022.
- Google trends, which represent the public attention to a crypto symbol based on keyword search frequencies on google search engine
- Sentiment data, which is a proxy of social attention to a symbol based on natural language processing analysis of social media.
- Crypto Fear and Greed Index, which provides an easy overview of the current sentiment of the Bitcoin / crypto market at a glance.
- Market data, which contains the price (open, high, low, close) and volume data of Bitcoin / Ethereum. Note that those are the data we think might be helpful, and it is by no means a definitive set of data that you must use. Feel free to explore other sources of data if you find them appropriate for this project.
Performance of Enigma
Section titled “Performance of Enigma”Every 12 hour, we run backtesting of all Enigma models and record the pnl of each of them.
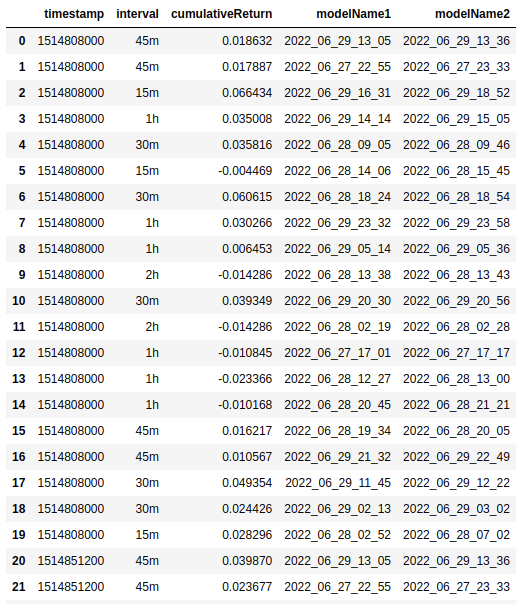
timestamp: timestamp of the beginning of a 12-hour time span (each row represents the pnl of the next 12-hour period).
cumulativeReturn : profit and loss data, cumulated profit or loss in percentage, e.g., 0.02 means 2% profit, and -0.01 means 1% loss
modelName1, modelName2: unique identifiers of a pair of models
Google Trends
Section titled “Google Trends”Every hour, we collect the google trends data for the keywords ‘bitcoin’ and ‘ethereum’.
time_hour: timestamp of the end of a 1-hour time span (each row represents the keyword-search volume of the past 1 hour period)
week_adj_hour, month_adj_hour, day_adj_hour, month_norm_day_adj_hour: they are essentially the same, just smoothed with different time scales, all representing google trends of searching interest of the crypto symbol.
Sentiment Data
Section titled “Sentiment Data”Every hour, we collect the sentiment data for the keywords ‘bitcoin’ and ‘ethereum’.
time_hour: timestamp of the end of a 1-hour time span (each row represents the sentiment values of the past 1 hour period)
price_usd : price of the crypto symbol in usd
transaction_volume : transaction volume of the crypto symbol
unique_social_volume_total_5m : the aggregation on top of the **social data **(a set of crypto-related discussions from the internet. It includes chat conversations, forum posts and comments, tweets, and other pieces of text). It takes into account only the unique text documents for each interval, i.e. duplicated messages will be excluded from the calculations, to measure the volume of mentions for a given asset or word.
social_dominance_total : compares the social volume of an asset to the combined social volume of the 100 largest market cap assets.
socail_volume_total: the total number of text documents that contain the given search term at least once.
Fear and Greed Index
Section titled “Fear and Greed Index”Every 24 hours, we collect the fear and greed data for the crypto market.
https://alternative.me/crypto/fear-and-greed-index/
https://alternative.me/crypto/fear-and-greed-index/
timestamp: timestamp of the end of a 24-hour time span (each row represents the fear and greed index of the past 24 hours period)
date: utc date of timestamp
fng_value: fear and greed index value
fng_classification: classification of public sentiment into ‘Fear’, ‘Extreme Fear’,’Greed’, ‘Extreme Greed’, and ‘Neutral’
Market data
Section titled “Market data”timestamp: Timestamp of the beginning of a 1-hour time span (each row represents the price and volume of the next 1-hour period).
volume: trading volume in the unit of the corresponding crypto, for example, volume=9.32 meaning 9.32 bitcoin/ethereum was traded during that hour.
open, high, low, close: the corresponding price information of the hour’s candlestick