Train, Validation, Test Datasets
Source: Notion | Last edited: 2022-12-21 | ID: a17f4d43-4b6...
The nomenclature of machine-assist trading strategy development can be confusing.
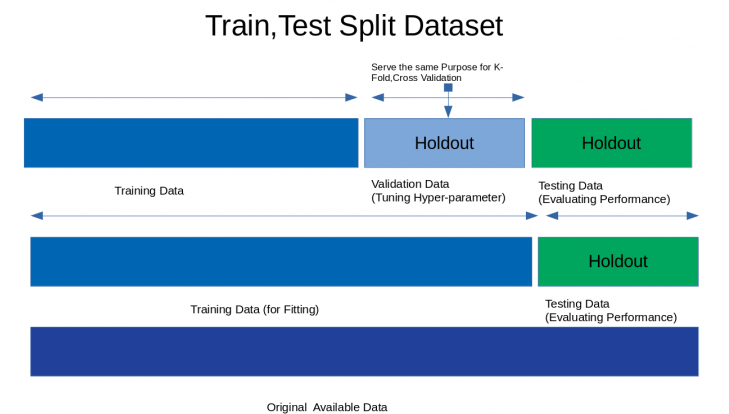
Usually, data are in two parts (blue & green) or in three segments (blue, blue-gray, green) that serve different purposes.
Two parts:
-
training (in-sample) data in blue is for curve-fitting
-
testing (out-of-sample) data in green is for evaluation
Training & Validating
Section titled “Training & Validating”The training data will be further separated into:
1a) training data in blue
1b) validation data in blue-gray
where 1a) is used to generate tons of strategies, and
where 1b) is used to simulate trades using what’s trained in 1a) then the performance results is validated (i.e. statistically judged) by machine.
🧩 The way that are used to segregate, re-arrange or randomize the in-sample data for 1b) purpose is called validating method. So, whenever we call validation in the context of machine-assist trading strategy development, we assume we’re talking about something within the AI training cycle. Interesting enough, EonLabs’ partnering researcher Sam doesn’t single out any portion unseen by AI to validate but simply present the whole in-sample dataset to AI for training purpose.
Testing
Section titled “Testing”As the last step in any strategy generation workflow, testing data (the Holdout data in green color) involve a small handful of equity curves generated by different models *evaluated *(i.e. aesthetically judged) by human (sometimes assisted by statistical performance matrices).
🧩 EonLabs’ partnering researcher Sam believes that the out-of-sample evaluation process is very important. He believed that 2) is something so important that better not leave it up to the machine to decide what’s best and it’s actually easier and quicker for humans to do the evaluation. Computing cycles on validation is not worth it, in Sam’s opinion. He didn’t see the value in doing it from his own empirical experience.