Dukascopy OHLC data 15T, 30T, … 1D
Source: Notion | Last edited: 2025-06-01 | ID: ffa2cf89-ee5...
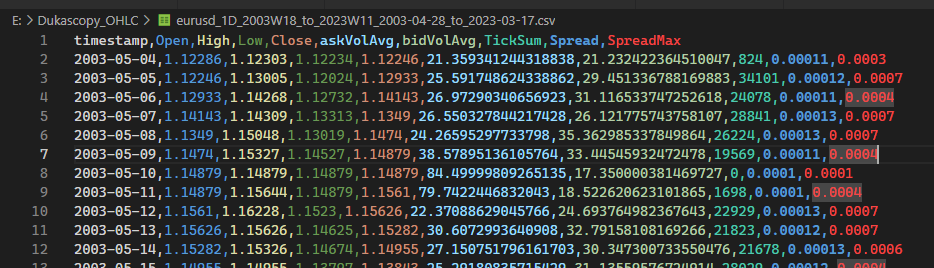
Download this zipped file that contains the conventional time-resampled OHLC data (15T, 30T, … 1D) with supplementary columns derived from the raw tick data:
What are the supplementary columns represent?
Section titled “What are the supplementary columns represent?”askVolAvg: mean of the best ask volume of every tick in million USD bidVolAvg: mean of the best bid volume of every tick in million USD TickSum: number of change of tick Spread: average difference between the best bid and the best ask SpreadMax: the maximum difference in spread among the TickSum number of ticks
What should be the assumed cost of transaction?
Section titled “What should be the assumed cost of transaction?”We use Dukascopy solely as a data source for backtesting, but we may not necessarily trade on it. The assumed commission cost is 2.00 USD per side per lot. This means that for each 100k unit of EURUSD in a LONG/SHORT position entered or exited, the broker charges a 2.00 USD commission. While Dukascopy does not have the best spread, there are alternative options. During the most active market hours, from London market open to New York market close, it is advisable to refer to MyFxBook Live Forex Spread Comparison with the Commissions checkbox ticked and enabled to take commission fees into consideration. Sort by clicking on the lowered unsponsored EURUSD link to see that some discount brokers, such as Tickmill and Fxview, often offer a combined cost of trade on the EURUSD trading pair at <2.00 USD per side per lot. Therefore, it is reasonable to assume that the cost of trade is 2.00 USD (or 4.00 USD per position) during active London & New York market hours. When backtesting, it is suggested to assume a single lot trade size to enter and exit a position.
What are the time zone of the timestamp?
Section titled “What are the time zone of the timestamp?”Their timezone is UTC+0, making it tricky to pinpoint the exact opening of the London market and the closing of the New York market due to the confusing summer daylight saving time shifts in and out of the calendar throughout the years. You may want to use 15T or 30T TickSum, VolAvg, and Spread as leading indicators to locate active market hours.
How are the data resampled from the Dukascopy raw tick by tick data?
Section titled “How are the data resampled from the Dukascopy raw tick by tick data?”Overview
Section titled “Overview”The Python script is designed to download historical tick data for a financial instrument from Dukascopy Bank, process and resample the tick data into various timeframes (e.g., 5-min, 15-min, 30-min, etc.), and store the output in .csv files. The script also includes the capability to plot TickSum data for the resampled timeframes.
Parameters
Section titled “Parameters”- instrument: a string representing the financial instrument (e.g., “eurusd”).
- start_week and start_year: integers representing the start week and year for data retrieval.
- end_week and end_year: integers representing the end week and year for data retrieval.
- output_folder: a string representing the output folder where the downloaded tick data will be stored.
- output_ohlc_folder: a string representing the output folder where the resampled OHLC data will be stored.
- output_format: a string representing the format of the output data (e.g., “csv”).
- timeframe: a string representing the timeframe of the data (e.g., “tick”).
- volumes: a boolean indicating whether to include volumes in the downloaded data.
- volume_units: a string representing the unit of the volumes (e.g., “millions”).
- lst_granularity: a list of strings representing the desired resampled timeframes.
- batch_size: an integer representing the number of files to process at a time.
Features
Section titled “Features”- Downloading Dukascopy historical tick data for a specific financial instrument and date range.
- Processing the downloaded tick data by resampling it into various timeframes.
- Saving the resampled data as .csv files.
- Plotting TickSum data for the resampled timeframes.
Outputs
Section titled “Outputs”The output of the script consists of .csv files containing the resampled OHLC data for the specified financial instrument and list of granularities.
Utility of the Outputs
Section titled “Utility of the Outputs”The output .csv files containing the resampled OHLC data can be used for financial analysis, backtesting trading strategies, and building financial models.
Step by Step on How to Use it
Section titled “Step by Step on How to Use it”- Set the required parameters (instrument, start_week, start_year, end_week, end_year, output_folder, output_ohlc_folder, output_format, timeframe, volumes, volume_units, lst_granularity, and batch_size) in the main function.
- Run the main function to download the historical tick data for the specified instrument and date range.
- The script will process the tick data and resample it into the desired timeframes specified in lst_granularity.
- The resampled data will be saved as .csv files in the output_ohlc_folder.
- The script will plot the TickSum data for the resampled timeframes if the plot_tick_sum function is called.
import datetimeimport osimport shutilimport subprocessimport zipfilefrom dateutil.relativedelta import relativedelta, SUimport pandas as pdimport globfrom rich import printimport timefrom typing import List
def week_number(date):    year_start = datetime.date(date.year, 1, 1)    first_sunday = year_start + datetime.timedelta(days=(6 - year_start.weekday()) % 7)    if date < first_sunday:        return 0    return (date - first_sunday).days // 7 + 1
def create_directory_if_not_exists(directory):    print(f"Creating directory {directory} if not exists...")    os.makedirs(directory, exist_ok=True)    print(f"Directory {directory} created (or already exists).")
def get_dukascopy_command(instrument, start_date, end_date, output_format, output_folder, timeframe, volumes, volume_units):    user_home = os.path.expanduser("~")    dukascopy_node_path = os.path.join(user_home, "AppData/Roaming/npm/dukascopy-node.cmd")    command = f"{dukascopy_node_path} --instrument {instrument} --date-from {start_date} --date-to {end_date} --timeframe {timeframe} --format {output_format} --directory {output_folder} --volumes {volumes} --volume-units {volume_units}"    print(f"Generated Dukascopy command: {command}")    return command
def run_dukascopy_command(command, output_folder):    print(f"Running Dukascopy command in folder {output_folder}...")    original_directory = os.getcwd()    os.chdir(output_folder)    try:        subprocess.run(command, shell=True, check=True)    finally:        os.chdir(original_directory)    print(f"Dukascopy command executed successfully.")
def load_and_modify_csv(output_folder, instrument, timeframe, start_date, end_date, output_format):    print(f"Loading and modifying CSV file...")    csv_file = os.path.join(output_folder, f"{instrument}-{timeframe}-{start_date}-{end_date}.{output_format}")    df = pd.read_csv(csv_file)    df['timestamp'] = pd.to_datetime(df['timestamp'], unit='ms')    print(f"CSV file loaded and modified successfully.")    return df
def get_new_csv_and_zip_filenames(instrument, timeframe, start_date, end_date):    start_date_as_date = datetime.datetime.strptime(start_date, '%Y-%m-%d').date()    end_date_as_date = datetime.datetime.strptime(end_date, '%Y-%m-%d').date()
    week_info_start = week_number(start_date_as_date)    year_start = start_date_as_date.year
    new_filename = f"{instrument}-{timeframe}-{start_date}-{end_date}-week-{week_info_start:02d}_of_{year_start}.csv"    zip_filename = f"{instrument}-{timeframe}-{start_date}-{end_date}-week-{week_info_start:02d}_of_{year_start}.zip"    folder_name = f"{instrument}-{year_start}-week-{week_info_start:02d}"    return new_filename, zip_filename, folder_name
def save_and_compress_csv(df, output_folder, new_filename, zip_filename):    print(f"Saving and compressing CSV file...")    new_csv_file = os.path.join(output_folder, new_filename)    df.to_csv(new_csv_file, index=False)    with zipfile.ZipFile(os.path.join(output_folder, zip_filename), 'w', compression=zipfile.ZIP_DEFLATED) as zipf:        zipf.write(new_csv_file, arcname=new_filename)    os.remove(new_csv_file)    print(f"CSV file saved and compressed successfully.")
def download_dukascopy_data(instrument, start_date, end_date, output_format, output_folder, timeframe="tick", volumes=True, volume_units="units"):    create_directory_if_not_exists(output_folder)
    command = get_dukascopy_command(instrument, start_date, end_date, output_format, output_folder, timeframe, volumes, volume_units)
    run_dukascopy_command(command, output_folder)
    df = load_and_modify_csv(output_folder, instrument, timeframe, start_date, end_date, output_format)
    new_filename, zip_filename, _ = get_new_csv_and_zip_filenames(instrument, timeframe, start_date, end_date)
    save_and_compress_csv(df, output_folder, new_filename, zip_filename)
def download_dukascopy_weekly_data(instrument, start_week, start_year, end_week, end_year, output_folder, output_format="csv", timeframe="tick", volumes=True, volume_units="units"):    start_date = datetime.date(start_year, 1, 1)    start_date += datetime.timedelta(days=(6 - start_date.weekday()) % 7)  # move to the first Sunday    start_date += datetime.timedelta(weeks=start_week - 1)  # move to the start_week-th Sunday
    end_date = datetime.date(end_year, 1, 1)    end_date += datetime.timedelta(days=(6 - end_date.weekday()) % 7)  # move to the first Sunday    end_date += datetime.timedelta(weeks=end_week)  # move to the end_week-th Sunday
    current_date = start_date    while current_date < end_date:        week_start = current_date        week_end = week_start + datetime.timedelta(days=6)
        new_filename, zip_filename, week_output_folder_name = get_new_csv_and_zip_filenames(instrument, timeframe, week_start.strftime("%Y-%m-%d"), week_end.strftime("%Y-%m-%d"))        week_output_folder = os.path.join(output_folder, week_output_folder_name)
        if not zip_file_exists(output_folder, zip_filename):            print(f"Zip file {zip_filename} not found. Downloading data...")            download_dukascopy_data(instrument, week_start.strftime("%Y-%m-%d"), week_end.strftime("%Y-%m-%d"), output_format, week_output_folder, timeframe, volumes, volume_units)
            print("Moving zipped CSV file to the upper directory...")            zip_file_path = os.path.join(week_output_folder, zip_filename)            os.rename(zip_file_path, os.path.join(output_folder, zip_filename))            print("Zipped CSV file moved successfully")
            print(f"Deleting weekly folder {week_output_folder}...")            shutil.rmtree(week_output_folder)            print("Weekly folder deleted successfully")        else:            print(f"Zip file {zip_filename} already exists. Skipping download...")
        current_date += datetime.timedelta(weeks=1)
def zip_file_exists(output_folder, zip_filename):    return os.path.exists(os.path.join(output_folder, zip_filename))
def read_zipped_csv(output_folder, zip_filename):    with zipfile.ZipFile(os.path.join(output_folder, zip_filename), 'r') as zipf:        # Get the name of the first (and only) file in the archive        csv_filename = zipf.namelist()[0]        with zipf.open(csv_filename) as csvfile:            df = pd.read_csv(csvfile)    return df
def combine_dataframes(dataframes):    combined_df = pd.concat(dataframes, ignore_index=True)    return combined_df
def get_filtered_zip_filenames(output_folder, instrument, timeframe, start_week, start_year, end_week, end_year):    start_date = datetime.date(start_year, 1, 1)    start_date += datetime.timedelta(days=(6 - start_date.weekday()) % 7)  # move to the first Sunday    start_date += datetime.timedelta(weeks=start_week - 1)  # move to the start_week-th Sunday
    end_date = datetime.date(end_year, 1, 1)    end_date += datetime.timedelta(days=(6 - end_date.weekday()) % 7)  # move to the first Sunday    end_date += datetime.timedelta(weeks=end_week)  # move to the end_week-th Sunday
    zip_filenames = []    current_date = start_date    while current_date < end_date:        week_start = current_date        week_end = week_start + datetime.timedelta(days=6)
        _, zip_filename, _ = get_new_csv_and_zip_filenames(instrument, timeframe, week_start.strftime("%Y-%m-%d"), week_end.strftime("%Y-%m-%d"))        zip_file_path = os.path.join(output_folder, zip_filename)
        if os.path.exists(zip_file_path):            zip_filenames.append(zip_file_path)
        current_date += datetime.timedelta(weeks=1)
    return zip_filenames
def process_batch(zip_filenames, output_folder, lst_granularity):    dataframes = []    for zip_filename in zip_filenames:        df = read_zipped_csv(output_folder, os.path.basename(zip_filename))        dataframes.append(df)
    combined_df = combine_dataframes(dataframes)    combined_df['Tick'] = 1    combined_df['Spread'] = combined_df['askPrice'] - combined_df['bidPrice']    combined_df['SpreadMax'] = combined_df['Spread']    combined_df['timestamp'] = pd.to_datetime(combined_df['timestamp'])    combined_df.set_index('timestamp', inplace=True)    print(f"Combined dataframe for {zip_filename}:\n{combined_df}")    resampled_df = combined_df.resample('1S').agg({'askPrice': 'mean', 'bidPrice': 'mean', 'askVolume': 'mean', 'bidVolume': 'mean', 'Tick': 'sum', 'Spread': 'mean', 'SpreadMax': 'max'})    print(f"Resampled dataframe for {zip_filename}:\n{resampled_df}")    resampled_df['Mid'] = resampled_df[['askPrice', 'bidPrice']].mean(axis=1)    resampled_df.fillna(method='ffill', inplace=True)
    resampled_dfs = {}    for granularity in lst_granularity:        ohlc_df = resampled_df.resample(granularity).agg({'Mid': 'ohlc', 'askVolume': 'mean', 'bidVolume': 'mean', 'Tick': 'sum', 'Spread': 'mean', 'SpreadMax': 'max'})        ohlc_df.columns = ['Open', 'High', 'Low', 'Close', 'askVolAvg', 'bidVolAvg', 'TickSum', 'Spread', 'SpreadMax']        resampled_dfs[granularity] = ohlc_df
    return resampled_dfs
import matplotlib.pyplot as pltimport matplotlib.dates as mdatesimport matplotlibimport tkinter as tk
def plot_tick_sum(df, granularity):    import matplotlib.pyplot as plt    import matplotlib    import tkinter as tk
    root = tk.Tk()    screen_width = root.winfo_screenwidth()    screen_height = root.winfo_screenheight()    matplotlib.rcParams['figure.figsize'] = (screen_width/100.0, screen_height/100.0)
    fig, ax = plt.subplots()    ax.plot(df.index, df['TickSum'], 'o', markersize=1)    ax.set_xlabel('Date')    ax.set_ylabel('TickSum')    ax.set_title(f'TickSum Chart - {granularity}')    ax.format_xdata = mdates.DateFormatter('%Y-%m-%d %H:%M:%S')    fig.autofmt_xdate()    plt.subplots_adjust(bottom=0.2)    ax.set_xlim(df.index[0], df.index[-1])    ax.set_ylim(df['TickSum'].min(), df['TickSum'].max())
    def onscroll(event):        axtmp = event.inaxes        x_min, x_max = axtmp.get_xlim()        x_diff = (x_max - x_min)        if event.button == 'up':            # Scrolling up, zooming in            axtmp.set(xlim=(x_min + x_diff / 10, x_max - x_diff / 10))        elif event.button == 'down':            # Scrolling down, zooming out            axtmp.set(xlim=(x_min - x_diff / 10, x_max + x_diff / 10))        fig.canvas.draw_idle()
    fig.canvas.mpl_connect('scroll_event', onscroll)    plt.show()
def save_csv_file(combined_df, instrument, granularity, start_year, start_week, end_year, end_week, start_date, end_date, output_folder):    new_filename = f"{instrument}_{granularity}_{start_year}W{start_week:02d}_to_{end_year}W{end_week:02d}_{start_date}_to_{end_date}.csv"    file_path = os.path.join(output_folder, new_filename)    combined_df.to_csv(file_path)
def main():    instrument = "eurusd"    start_week = 18    start_year = 2003    end_week = 11    end_year = 2023    output_folder = "E:\Dukascopy_Tick_Data"    # output_folder = "E:\Dukascopy_Tick_Data_01"    output_ohlc_folder = "E:\Dukascopy_OHLC"    # output_ohlc_folder = "E:\Dukascopy_OHLC_01"    output_format = "csv"    timeframe = "tick"    volumes = True    volume_units = "millions"    lst_granularity = '5T 15T 30T 1H 2H 3H 4H 6H 8H 1D'.upper().split()    # lst_granularity = '1T'.upper().split()    batch_size = 5  # Specify the number of files to process at a time
    download_dukascopy_weekly_data(instrument, start_week, start_year, end_week, end_year, output_folder, output_format, timeframe, volumes, volume_units)
    zip_filenames = get_filtered_zip_filenames(output_folder, instrument, timeframe, start_week, start_year, end_week, end_year)    print("Filtered zip filenames:", zip_filenames)
    combined_dfs = {granularity: [] for granularity in lst_granularity}
    for i in range(0, len(zip_filenames), batch_size):        batch_zip_filenames = zip_filenames[i:i + batch_size]        print(f"Processing batch {i // batch_size + 1}: {batch_zip_filenames}")
        batch_dfs = process_batch(batch_zip_filenames, output_folder, lst_granularity)        for granularity, df in batch_dfs.items():            combined_dfs[granularity].append(df)
    for granularity in lst_granularity:        combined_dfs[granularity] = pd.concat(combined_dfs[granularity]).sort_index()        combined_dfs[granularity]['Open'] = combined_dfs[granularity]['Open'].round(5)        combined_dfs[granularity]['High'] = combined_dfs[granularity]['High'].round(5)        combined_dfs[granularity]['Low'] = combined_dfs[granularity]['Low'].round(5)        combined_dfs[granularity]['Close'] = combined_dfs[granularity]['Close'].round(5)        combined_dfs[granularity]['askVolAvg'] = combined_dfs[granularity]['askVolAvg'].round(15)        combined_dfs[granularity]['bidVolAvg'] = combined_dfs[granularity]['bidVolAvg'].round(15)        combined_dfs[granularity]['Spread'] = combined_dfs[granularity]['Spread'].round(5)        combined_dfs[granularity]['SpreadMax'] = combined_dfs[granularity]['SpreadMax'].round(5)        start_date = datetime.date.fromisocalendar(start_year, start_week, 1)        end_date = combined_dfs[granularity].index[-1].date()        save_csv_file(combined_dfs[granularity], instrument, granularity, start_year, start_week, end_year, end_week, start_date, end_date, output_ohlc_folder)


        #^ Plot TickSum for the current granularity        # plot_tick_sum(combined_dfs[granularity], granularity)
if __name__ == "__main__":    main()
📍 Recruitment Board 🔑 ** Guest Researcher Area (accessible by invitation only) **🔒
- [LOB Data on S3 🔏](/engineering/integrations/lob-data-on-s3/)- [Algo-Trading Books 🔒](/research/books/algo-trading-books/)🔆 External Links
- [**Link-in-Bio for EonLabs**](https://bit.ly/m/eonlabs)- [**Indeed Company Page**](https://ca.indeed.com/cmp/Eonlabs)- [**EonLabs.com Official Site**](https://www.eonlabs.com/)🍁 EonLabs acknowledges that the land on which we live and work is the unceded traditional territories of the xʷməθkʷəy̓əm (Musqueam Indian Band), Sḵwx̱wú7mesh (Squamish Nation), and səlilwətaɬ (Tsleil-Waututh Nation) and we are grateful for the opportunity to do so.